InterQuartile Range (IQR) Calculator
In descriptive statistics, the interquartile range (IQR), also called the midspread or middle fifty, is a measure of statistical dispersion, being equal to the difference between the upper and lower quartiles, IQR = Q3 − Q1. In other words, the IQR is the 1st Quartile subtracted from the 3rd Quartile; these quartiles can be clearly seen on a box plot on the data. It is a trimmed estimator, defined as the 25% trimmed mid-range, and is the most significant basic robust measure of scale.
Data set in a table
-
i x[i] Quartile 1 102 2 104 3 105 Q1 4 107 5 108 6 109 Q2
(median)7 110 8 112 9 115 Q3 10 116 11 118
For the data in this table the interquartile range is IQR = 115 − 105 = 10.
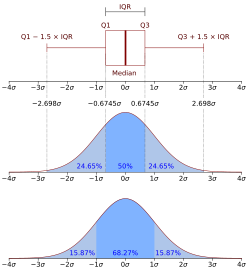
Boxplot (with an interquartile range) and a probability density function of a Normal N(0,σ2) Population